CHALLENGE

End-to-end design, research to UI
Turning complex data into actions
CHALLENGE
No single real-time view of markets and fixtures.
Manual competitor comparison.
Slow identification of missing coverage.
High cognitive load in data-heavy systems.
BACKGROUND
Monitor live markets and odds
Compare coverage against competitors
Instantly add missing fixtures
Analyze performance over time
DESIGN PROCESS
1. The Start
At the beginning, I focused on understanding how traders make decisions during live events, where time is critical and attention is limited.
2. The Process
By reviewing workflows and existing tools, it became clear that traders spent too much time scanning data and switching between systems just to understand what was happening.
3. The Insight
Speed matters more than depth. Traders need instant clarity and the ability to act immediately, which led to real-time–first dashboards, clear visual signals, and one-click actions.


User Flow
Before: Multiple tools, manual steps, delayed action.
After: One notification, one click, immediate fix.

Solutions

Real-Time Monitoring
A single dashboard showing live scores, fixture status, and odds movements.
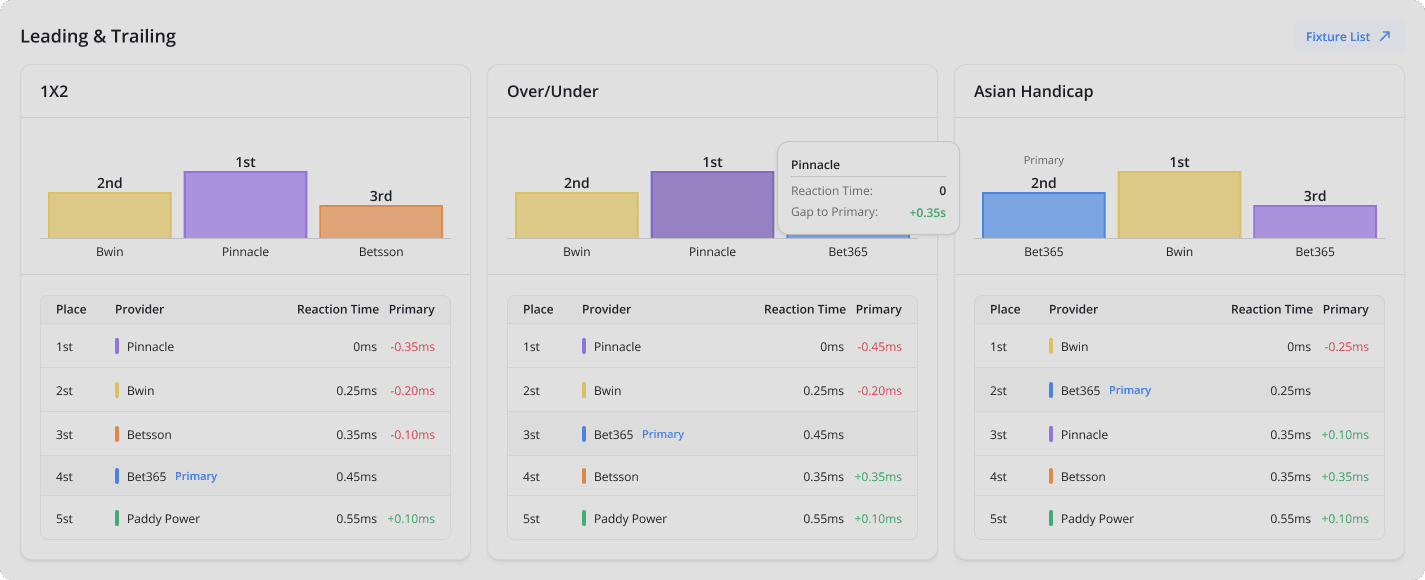
Competitor Benchmarking
Side-by-side comparison against up to five competitors to quickly spot coverage gaps.


One-Click Fixture Ordering
Missing fixtures can be added instantly, directly from the comparison view.
Takeaway
This project reflects how I design complex systems: simplifying data, prioritizing what matters, and building UX that supports fast, confident decisions.